Lines Walking
2022-02-09“Lines Walking” is a “long-form” generative series of 44 pieces made for the pen-plotter. The project is published on Plottables, and all editions were minted on February 9th, 2022.
Each edition of 44 is generated from a single piece of computer code, and is tokenized for ownership. In addition, each edition will be plotted once , and will be made available to its owner for the price of shipping.
Once all editions are plotted, each “Lines Walking” has a physical and digital instantiation; I strongly encourage owners to keep these together as they are separate representations of the same piece. Owners are welcome to sell their digital token without claiming the physical plot. The new owner can claim it instead once the plot is available.
This piece is a study of the interaction of simple rules, relying heavily on repetition to highlight how complex and subtle these interactions become.
high-res · ropsten
All Outputs are Plotted
Over the past few years while creating plotter artwork, I’ve grown to really appreciate the physicality of the plotter’s output. There is something magical about the way the plotter translates computer instructions into a real-world image. The same can’t be said when using an LCD screen or inkjet printer for example, even if these devices are also “just” translating computer instructions into an image.
Plotting a piece in watercolor adds another level to this magic. The ultra-high precision of the plotter is a strange but wonderful complement to the unpredictability of watercolor paint. When done right, the output sits at a surreal intersection between human and machine.
As a result, each edition of “Lines Walking” will be plotted and given to the owner for the price of shipping. However, the plots won’t be available immediately after minting; it can take hours to complete just a single color, and if any mistakes occur, the plot needs to be restarted from scratch. To accomodate this, plots will be made available one-by-one on a fixed schedule.
Very slow... But the best way to get consistent brush strokes #plottertwitter #watercolor pic.twitter.com/XyfM7hEOGo
— Lars Wander (@larswander) January 30, 2022
What’s Being Drawn
One thing I love about generative art is its ability to draw attention to the beautiful complexity that can emerge from the right set of simple rules. The fact that this emergent complexity exists is no longer a surprise these days. However, where this complexity exists, and how it is expressed can be wonderful to discover.
It’s by no means necessary to understand what the code is doing in a generative artwork to appreciate it, but I strongly believe that even having only a high-level understanding of the code behind a piece of art enhances it.
The core idea behind “Lines Walking” is as follows: Lines advance on a hexagonal grid, traveling from one neighboring cell to the next. If they reach a cell on the grid that’s already occupied, they change direction using a programmed rule to find their next cell. If all of their options are exhausted, or they’ve traveled a predefined number of steps, they stop advancing.
To make that a little clearer, let’s use some diagrams:
There is a arrow pointing in the direction of our first line in green, and a circle denoting the starting point. Let's advance it a few steps to see where it ends up.
Rule feature controls how a line changes direction from one
step to the next. For this example, the green line is following Rule:
A, meaning it will continue in the same direction until it
reaches an obstacle. Rule and other features are explained
in more detail below.
To make things more interesting, let's see what happens when multiple lines advance on the same grid.
The majority of the diversity in output from this program stems from the choice of starting coordinates and directions. Let’s see what happens when we start with just 2 lines.
The
Rule feature controls how lines
respond to occupied cells. The Rule: A trait
requires a line to advance in one direction until the next cell in front of it
is occupied. At that point, the line "turns left" until it either finds an
unoccupied neighboring cell, or it is finished advancing. Let's see what happens using these rules.
To see how this works with hundreds of lines, I’ve animated the process for a few test mints:
Why Hexagons?
“Lines Walking” started in the early Winter of 2021 on a square grid with borders around the edges. I really liked the aesthetic of the square grid, but quickly discovered that having the edges “wrap” around produced much more interesting results, as it breaks up a single line into many segments that trace one another around the page.
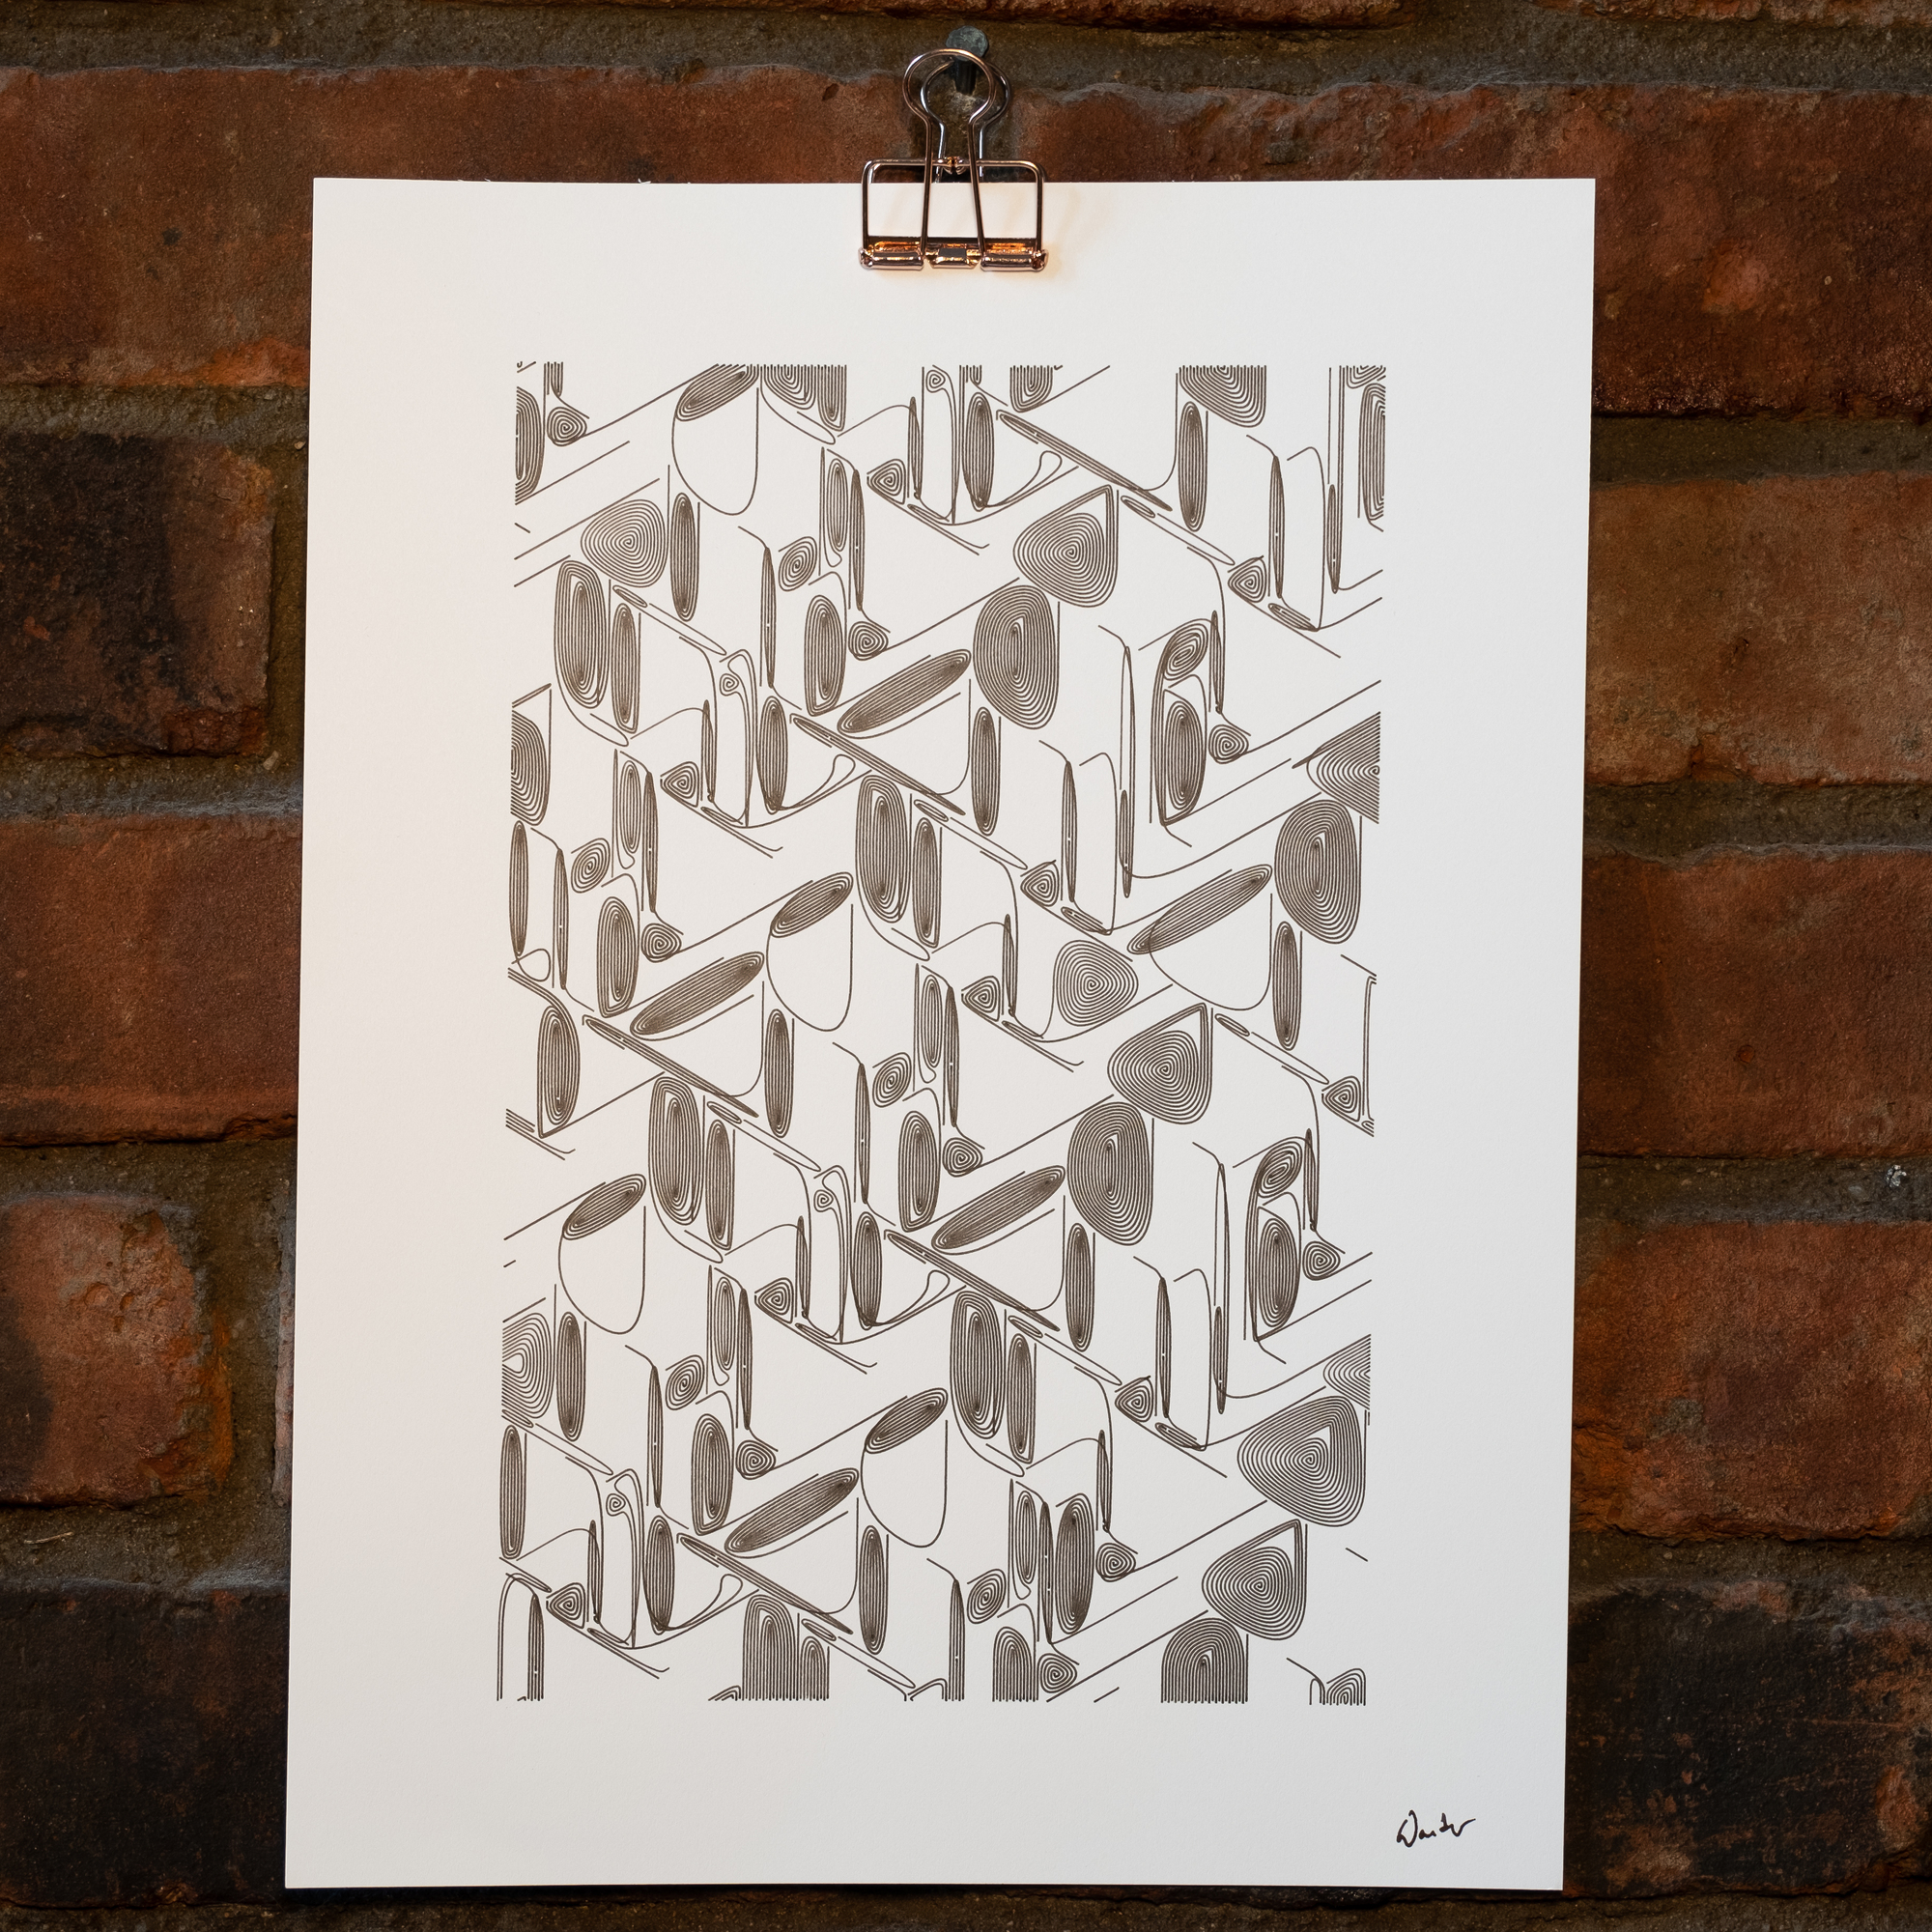
The square grid was wonderful for drawing abstract forms with very long lines and pronounced curves. The plots I made with pen and a square grid are still some of my favorites:
Spring 2021 · high-res
However, I discovered that unlike on the square grid, placing the lines at regular intervals on a hexagonal grid resulted in intricate, nestled, and diverse patterns. The amount of variety in the images that came from only small tweaks in the program’s parameters was very exciting, and I spent many hours looking at its different outputs.
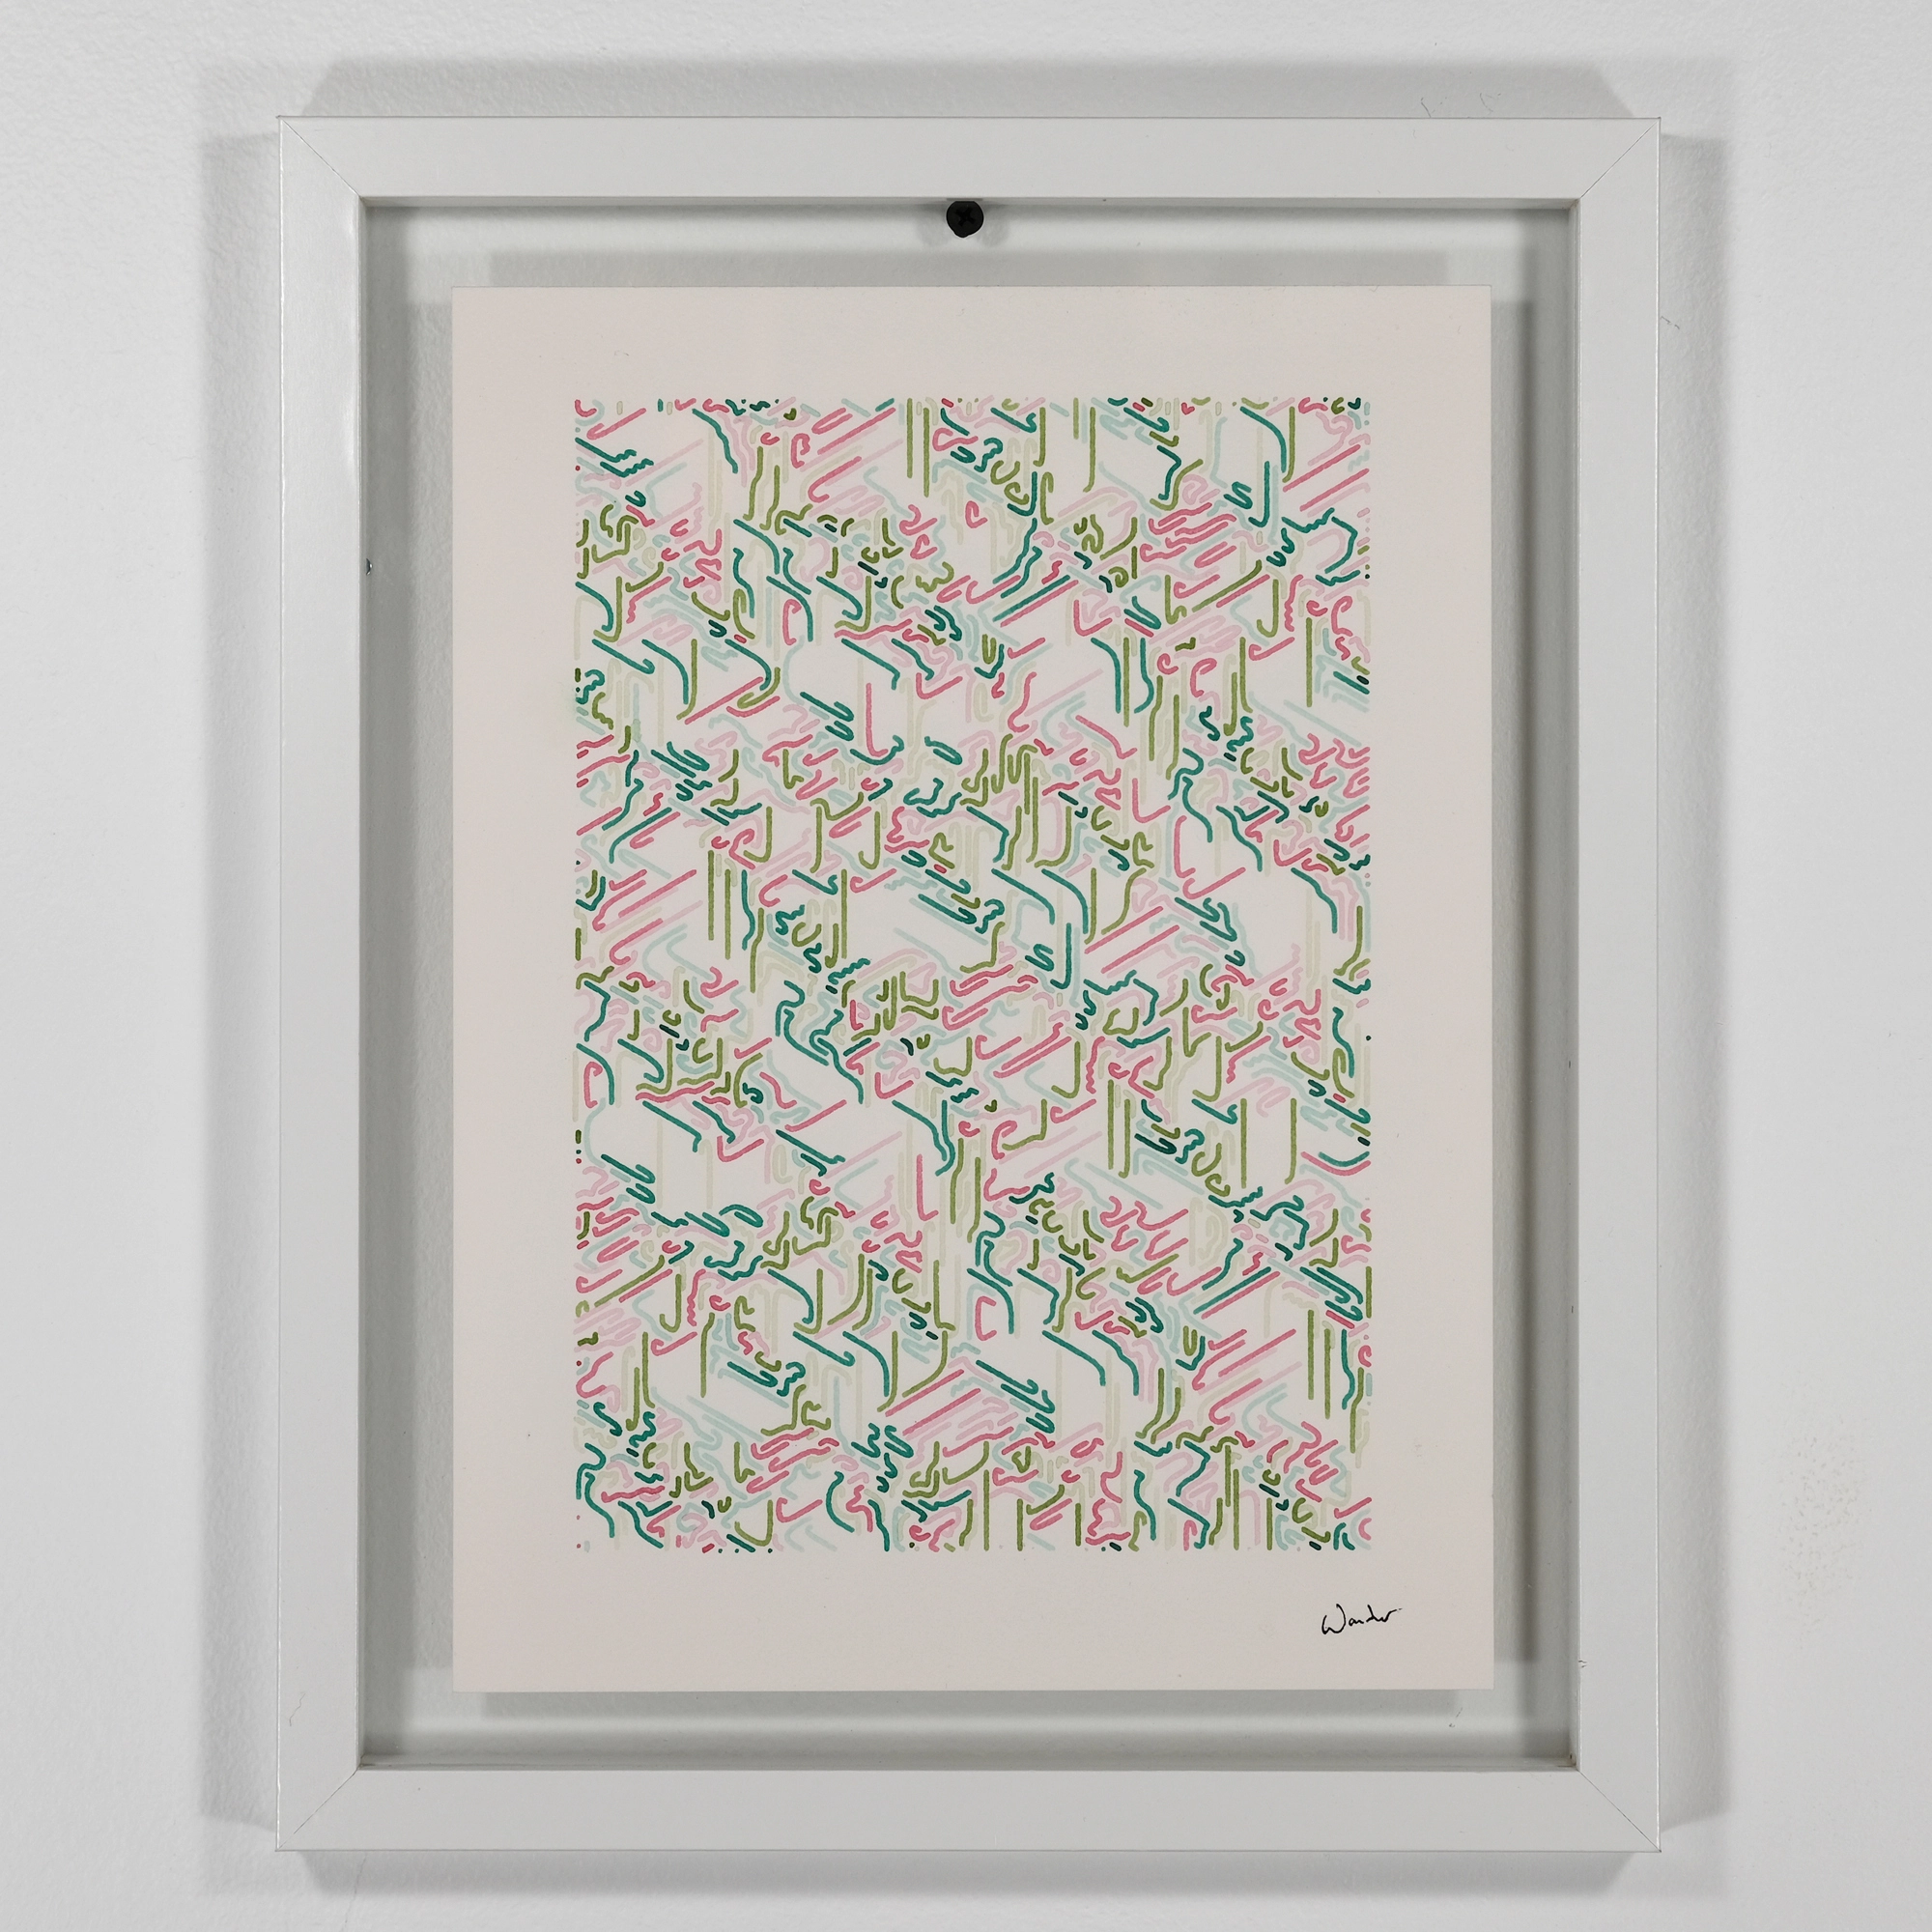
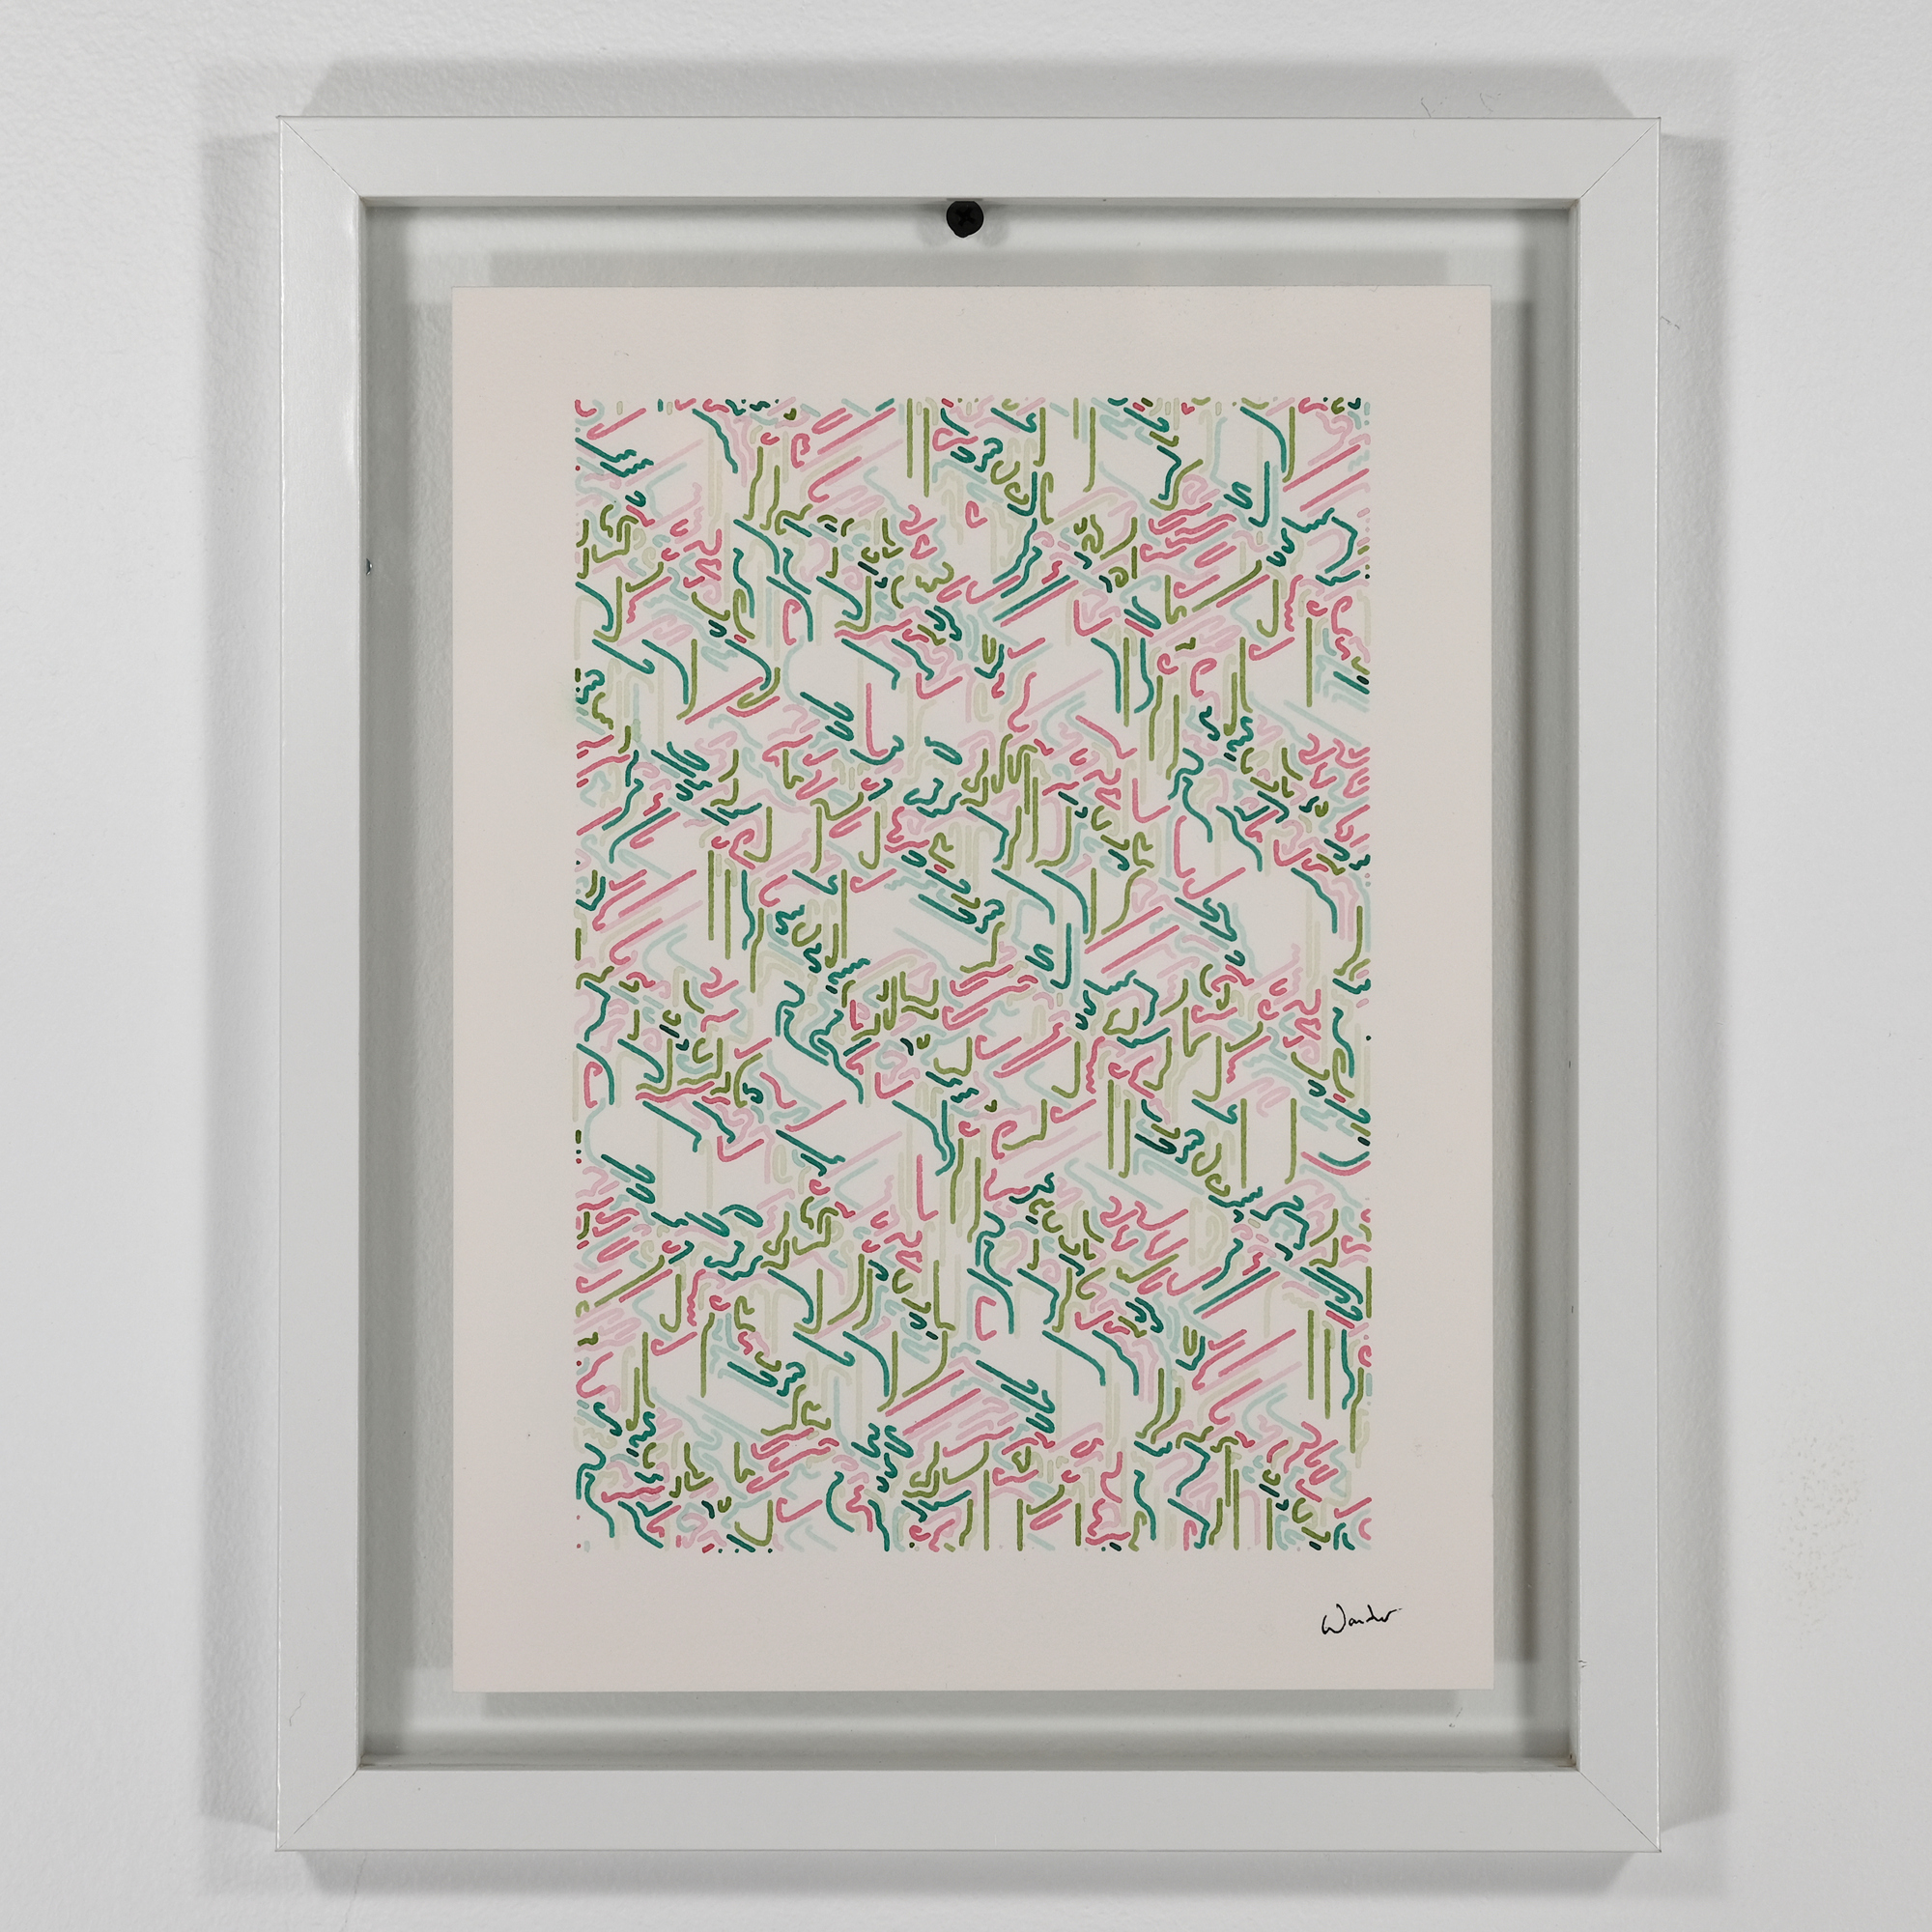
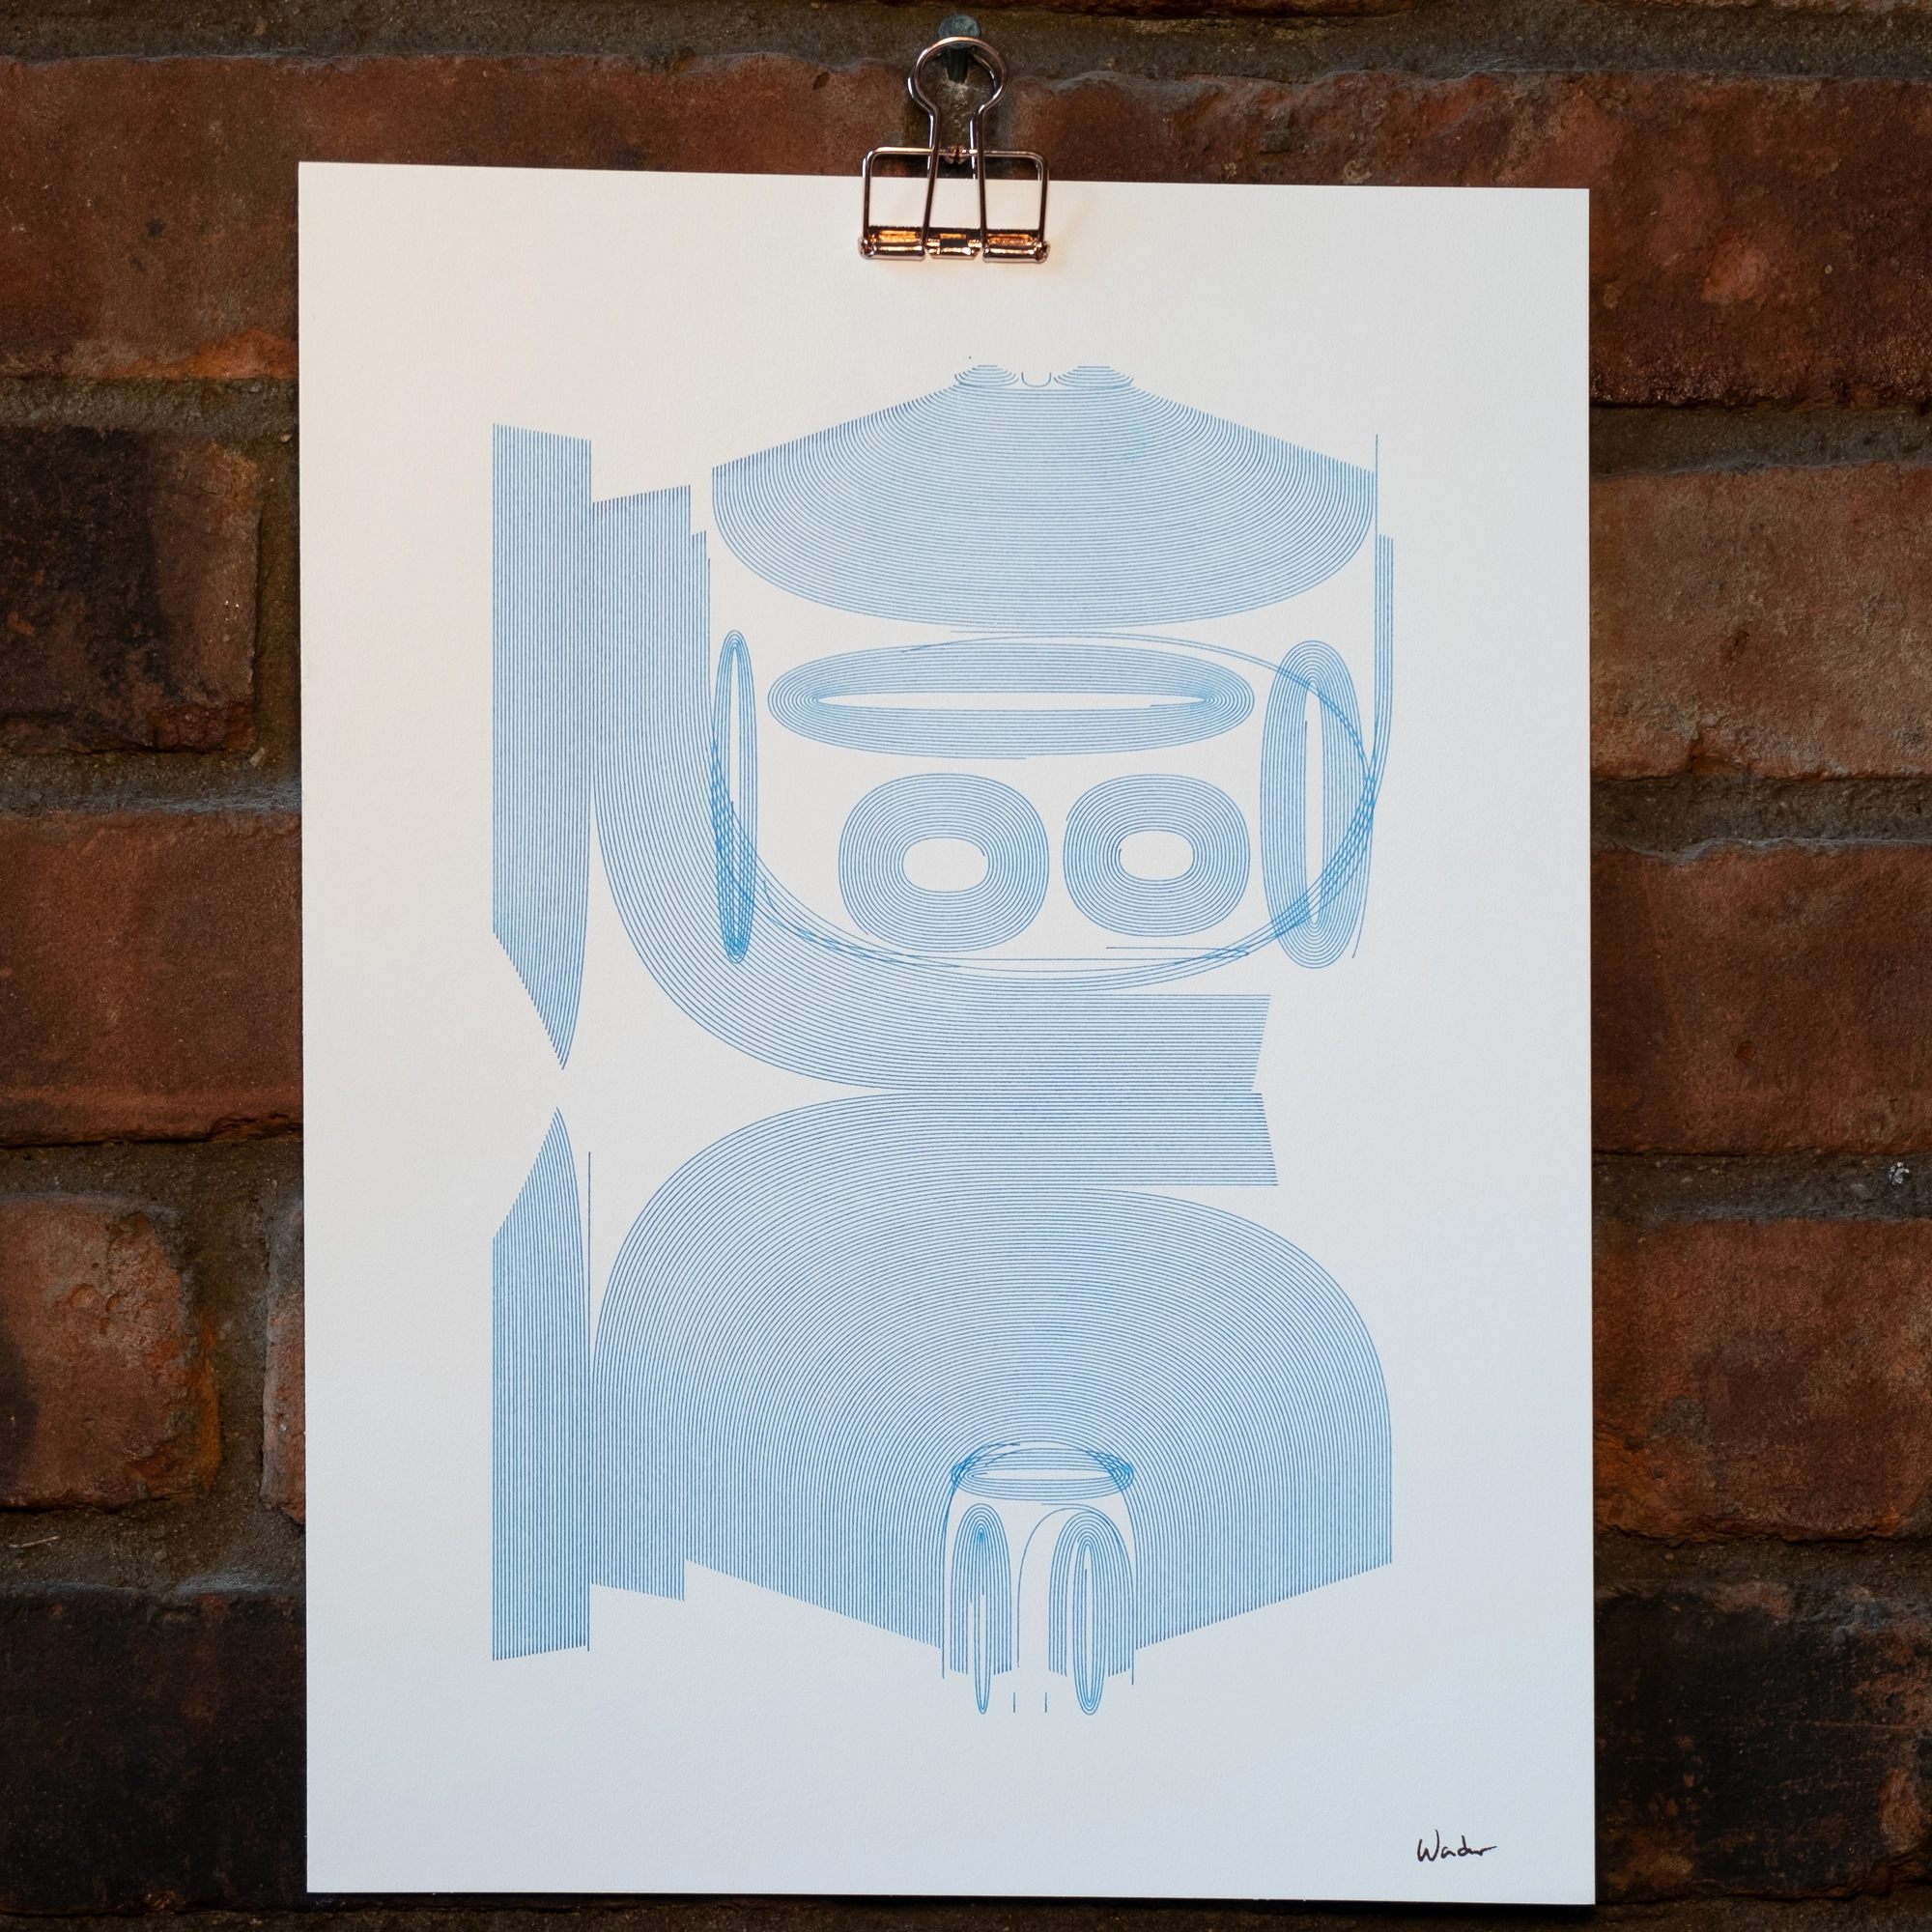
By the nature of the hexagonal grid, the figures drawn by the lines often look like they are rendered isometrically. This gives many of the outputs a strange, and slightly surreal feeling of perspective.

Spring 2021 · high-res
The density you can achieve by plotting with a fine-tipped pen is very appealing to me. However, with later experimentation, I found that this algorithm is far more interesting when visualized in watercolor. Not only does this provide a far wider range of colors to work with, but each stroke is given a gradient from dark to light in the direction the line’s travel. I personally love it when properties of a generative system are made visual like this.
Plotting in Watercolor
I’ve done a longer writeup on my watercolor plotting process. Here I’ll cover what’s unique to this project.
It’s important to me that the outputs of this program are all plotted, and don’t exist only as SVGs. This, coupled with the slow paint strokes of the plotter are why the edition count is so “low” compared to many other long-form generative pieces.
Watercolor lines that almost touch, so satisfying#plottertwitter #axidraw pic.twitter.com/1D9luZMSRt
— Lars Wander (@larswander) December 15, 2021
In order to help make these more easily reproducible, and not fret with large batches of pre-mixed paint, I limited myself to using the available Windsor & Newton tube paints. Finding color schemes that worked for this format took dozens and dozens of test prints.
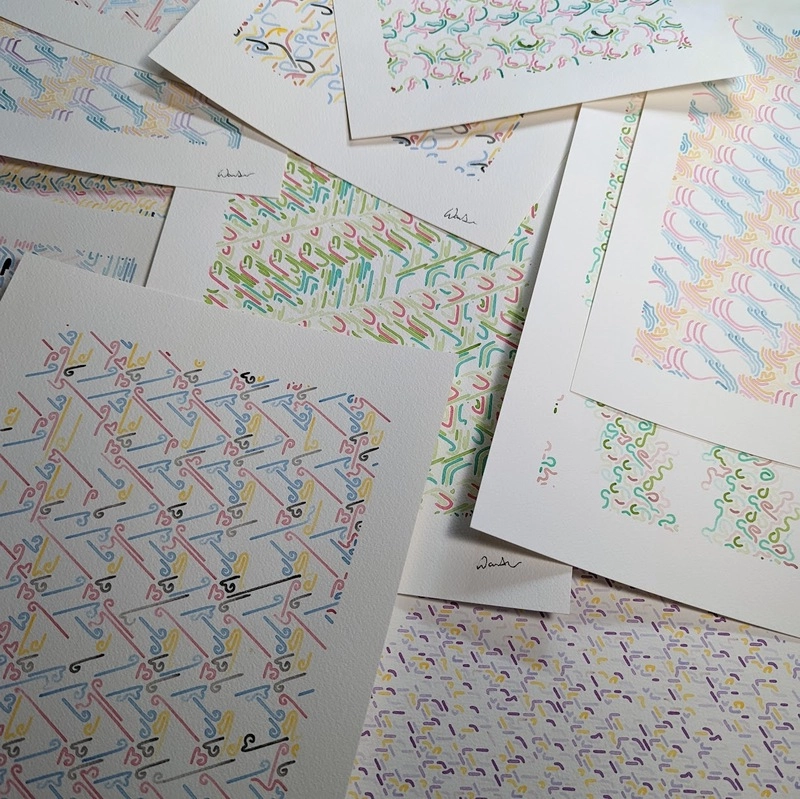
I found that approximating colors in RGB space on a monitor was never a proper replacement for actually plotting them.
Use of Color
Each line is colored according to its starting direction. This means there are 6 possible colors to assign. I wound up using 3 base colors, each mixed to 2 levels of opacity. Lines that start in opposite directions use the same base color, mixed to different levels.
Coupling the starting direction and color is a very conscious choice to enforce the repetition across the canvas, as well as highlight where the repetition breaks down. You’ll find many similar lines drawn in a single color, and easily be able to pick out where they deviate from their pattern.
DIY
Despite offering a plot of each edition, I hope people try to plot these at home! This section is for those brave plotters who want to do it themselves.
There are two competing approaches to creating watercolor plots, and it stems from the need to load your brush with paint.
In the first approach, as long as you know where your paint wells are, you can embed brush stroke paths into the final plotter file (i.e. SVG) as the piece is rendered. This is what Licia He does, and you can see this in her PlotterFile in the “C” shapes were paint refills occur:

The alternative approach is to ignore the paint wells when the plot is generated, and instead determine when and how to load the brush at plot-time. This is the approach I chose, mainly for the flexibility as well as for how it fits into my current plotter workflow. As a result, only the paths used to draw the image are included in each “Lines Walking” SVG.
One upside to this approach is that you can just as easily plot this in pen, or even better, in marker. I don’t have any colored markers (beyond a few sharpies), so I would love it if someone could plot one of these for themselves in marker and share a picture (#lineswalking).
The downside is that if you do want to plot in watercolor, you will need to write some custom code. Here is a very high-level approach to get you started:
- Each layer (
<g>tag) in the SVG has aclassattribute corresponding to the Windsor & Newton paint used. As mentioned above, each paint is mixed to a “regular”, and “lighter” opacity. The “lighter” opacity is denoted with-faintin the layer’sclassattribute. - Before every
<polyline>in each layer, insert a<circle>with its center (cx,cy) on the target paint tray if and only if the the<polyline>has classrefill. This is important, as paint is only applied at the start of a line, even if it “wraps” around from one side of the hexagonal grid to the other.
As an example, I’ve highlighted where to insert refills in this fictional SVG:
<svg xmlns="http://www.w3.org/2000/svg ...>
  <g class="viridian" ...>
    <!-- insert a paint refill <circle> here -->
    <polyline class="refill" points="..."></polyline>
    <polyline class="no-refill" points="..."></polyline>
    <!-- ... and here -->
    <polyline class="refill" points="..."></polyline>
    ...
  </g>
  <g class="sap-green" ...>
    ...
  </g>
  <g class="rose" ...>
    ...
  </g>
  ...
</svg>
If you plot the resulting SVG, the plotter will make a “circle” in your paint tray before every line that requires a paint refill.
Features
Each “Lines Walking” piece is generated with 6 features: Rule,
Color, Steps, Fullness, Curves, Breaks.
RuleAs mentioned above, this feature controls how lines change direction each step, and what they do when they collide with another line. There’s an endless number of rules that could be created, but I chose these 4 for their visual properties:Awill always continue in the same direction until it collides with another line. Once that happens, it will turn right until it finds an empty cell, and continue in that direction. Both pen plots above (hexagonal and square) were plotted with this rule. Its the simplest rule of the 4, as it keeps track of no state and turns only when a collision happens.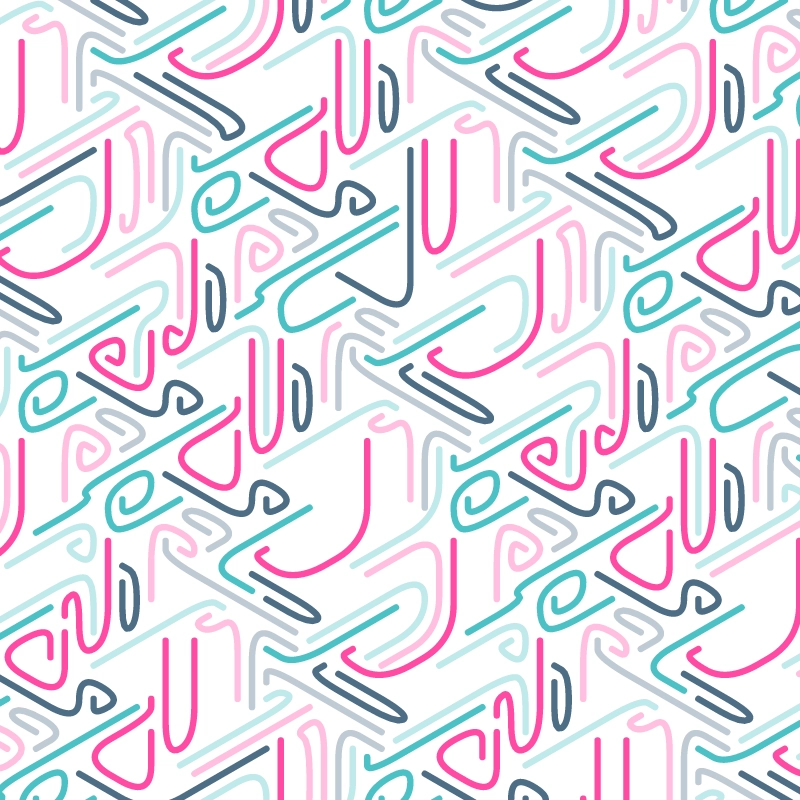
Bwill always try to continue in the same direction it started in. This results in lines froming little "squiggles" as they weave back and forth trying to face their target direction.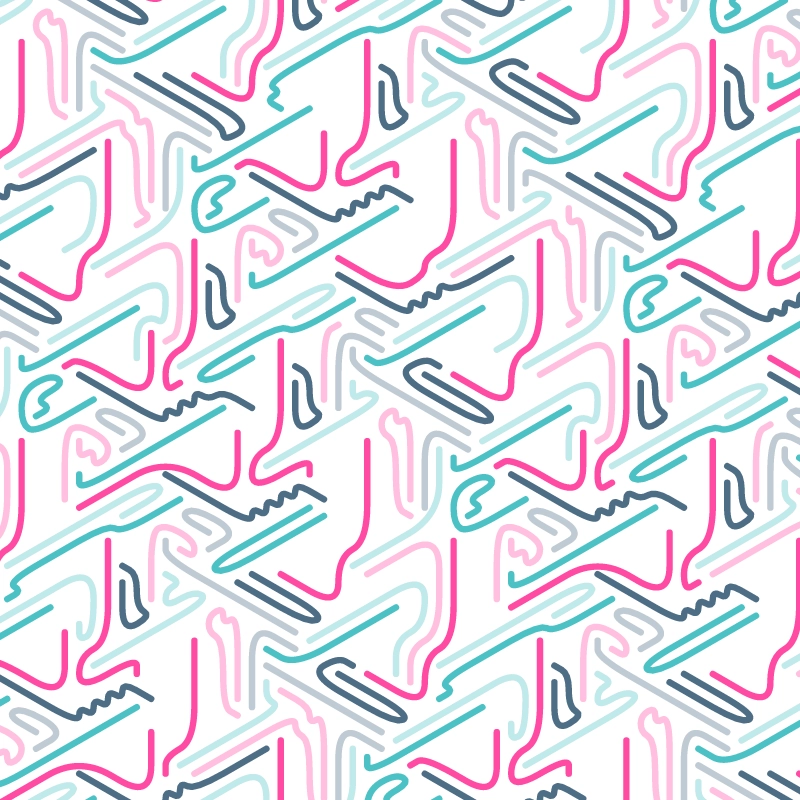
Cis like ruleB, in addition to turning right every 3 steps. 3 was chosen to form what look like circles when the lines don't collide and theCurvesattribute is set. When they do collide, they produce some very organic and nestled forms.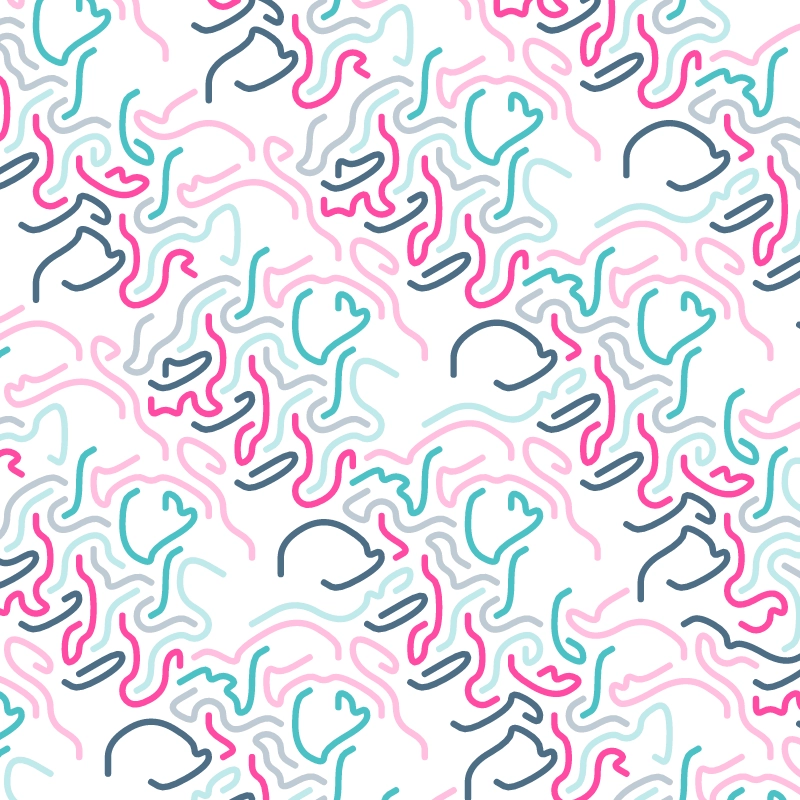
DGoes straight until it collides with another line. Then it turns and steps repeatedly until it collides with itself ending its run. This is what forms their round end-caps. I found these cute, as they seem to curl up and give up the moment they run into trouble.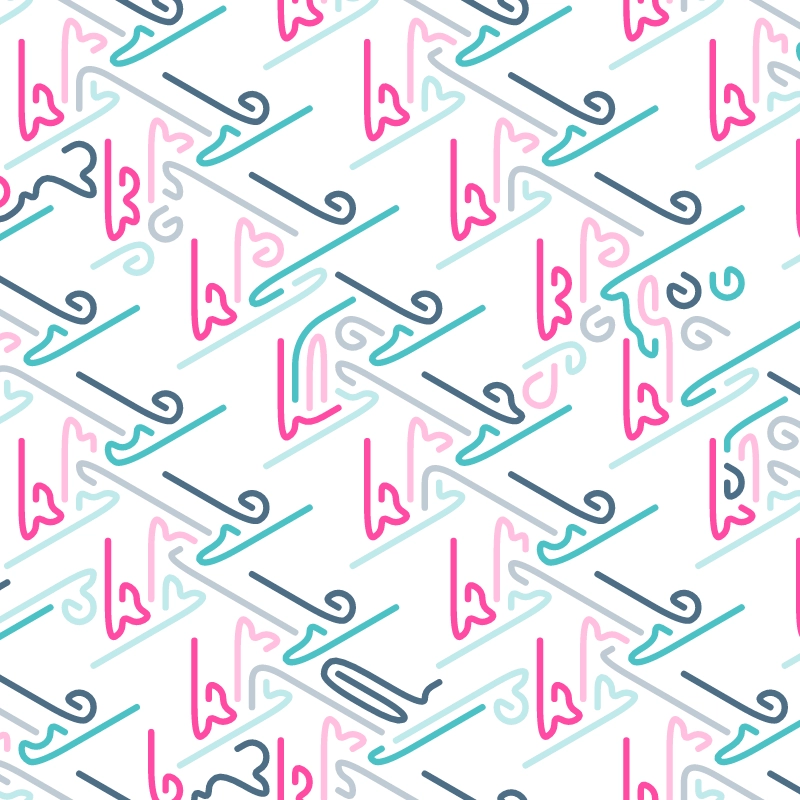
ColorThere are also 4 color schemes. How lines are assigned colors is explained above.Meadowis drawn in Viridian, Sap Green, and Permanent Pink.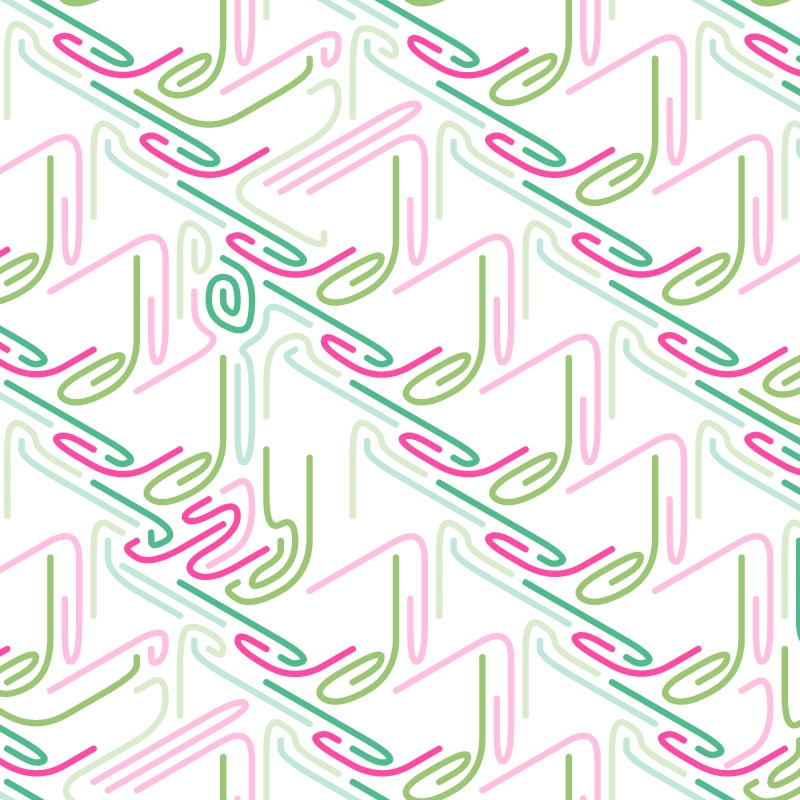
Blushis drawn in Cobalt Turquoise, Prussian Blue, and Permanent Pink.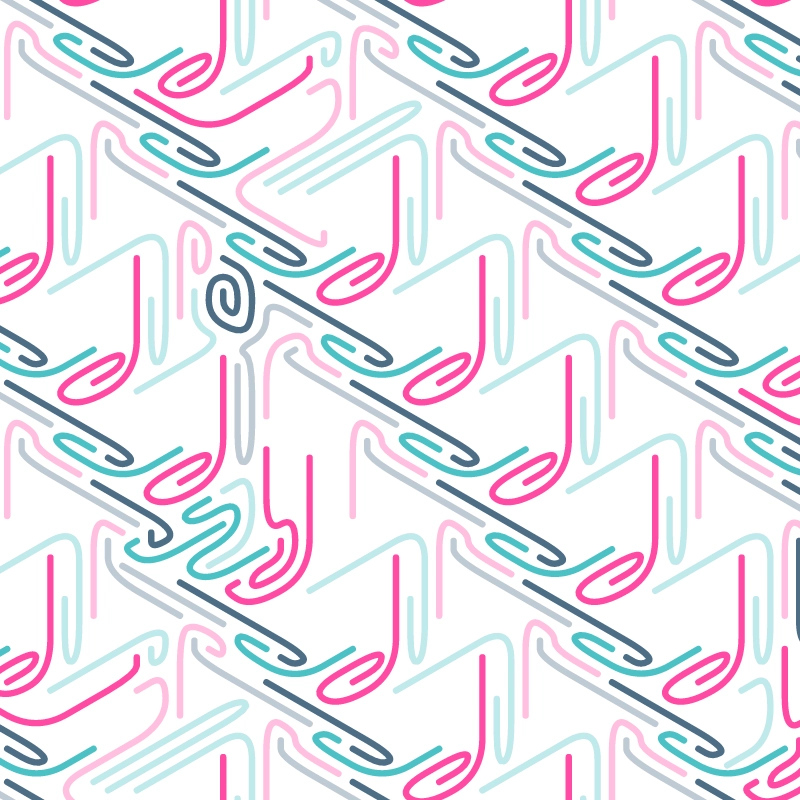
Contrais drawn in Cobalt Turquoise, Gold Ochre, and Quinacridone Violet.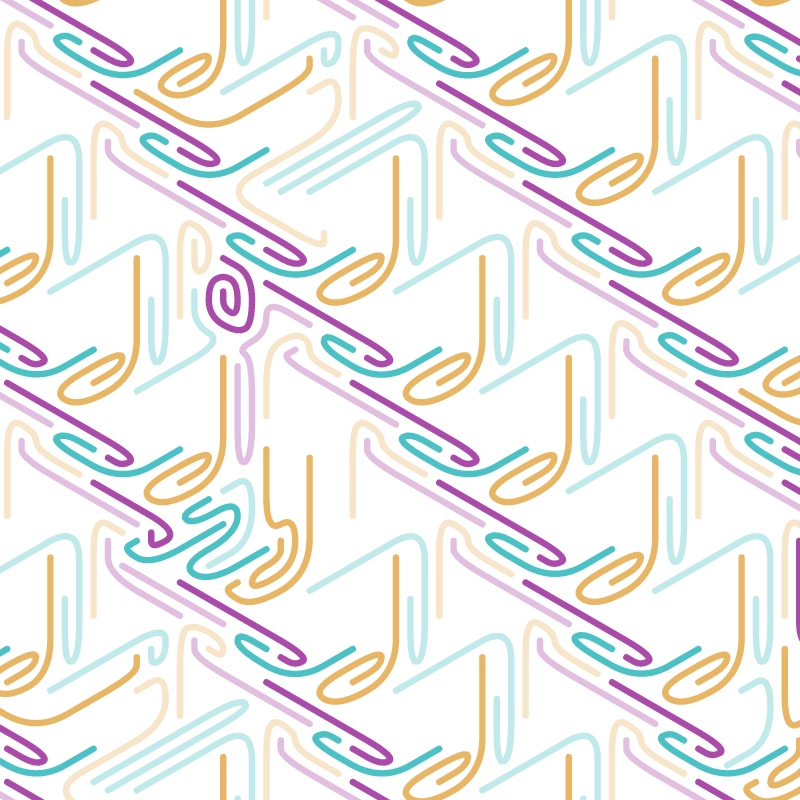
Goldis drawn in Cobalt Turquoise, Gold Ochre, and Permanent Pink.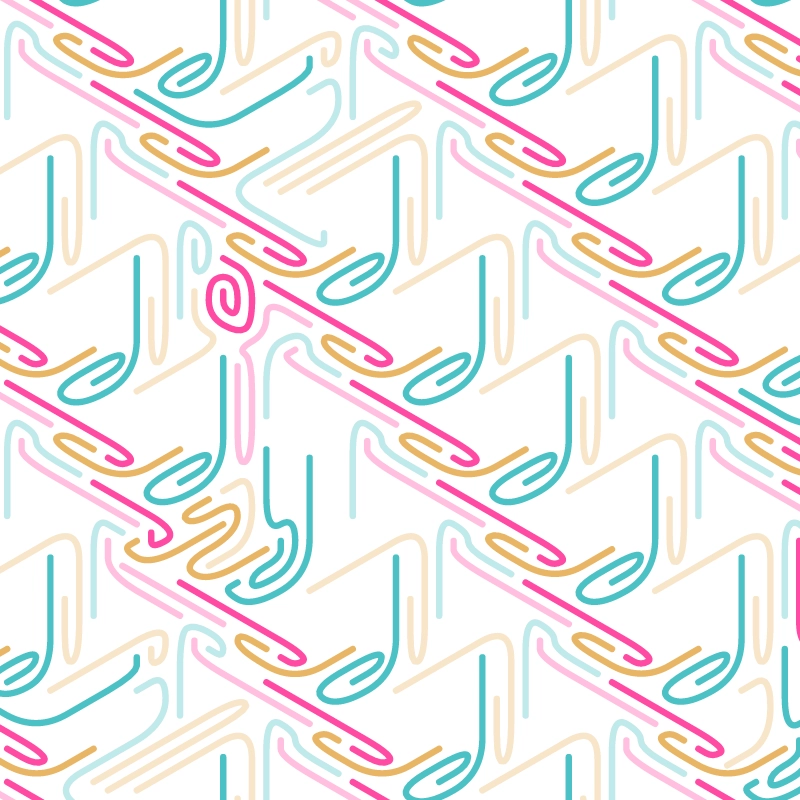
StepsandFullnessThese two feature values work together to determine how many lines to place on the canvas.Stepsranges from7to21, and sets a cap on how many times a line can advance from one cell to the next.Fullnessis one ofSparse,Moderate, orPacked. Given a max step count and target fullness, “Lines Walking” places an appropriate number of lines to achieve that fullness.Low ( 7) step count, withPackedfullness.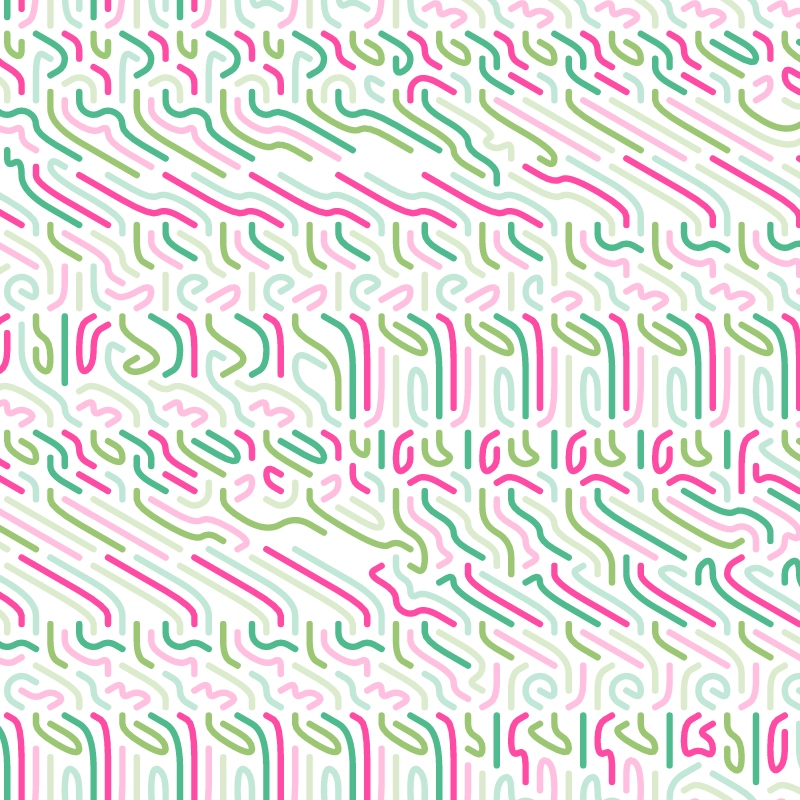
High ( 21) step count, withSparsefullness.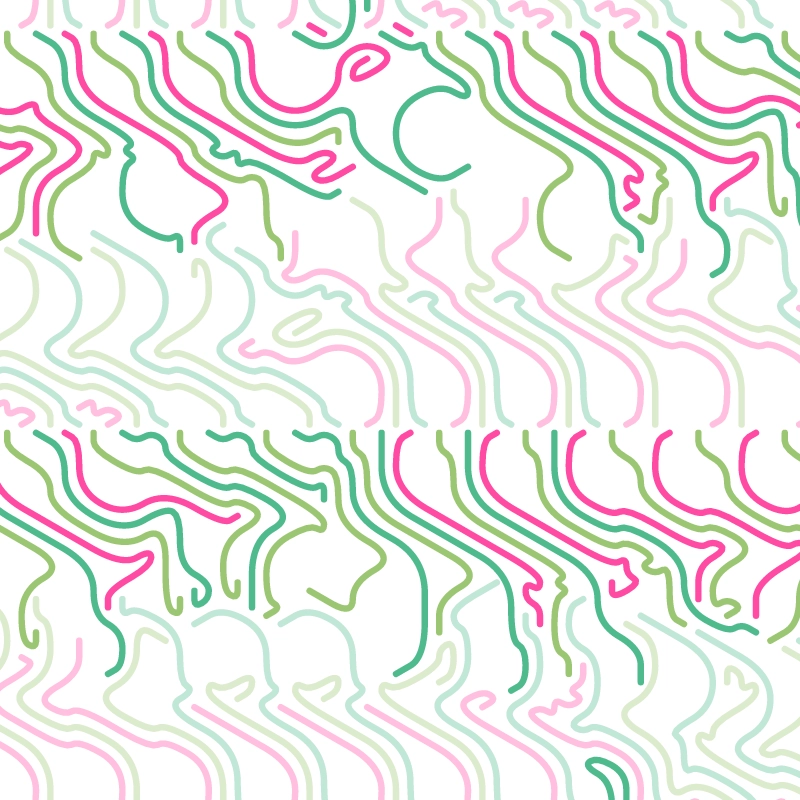
Curvesis a boolean controlling whether or not lines have curves applied at the corners. When plotting in pen, I find the corners without curves to be too harsh-looking. However, in watercolor they can look quite nice as the thicker strokes and rounded brush help to smooth out the sharper angles.Curvesapplied.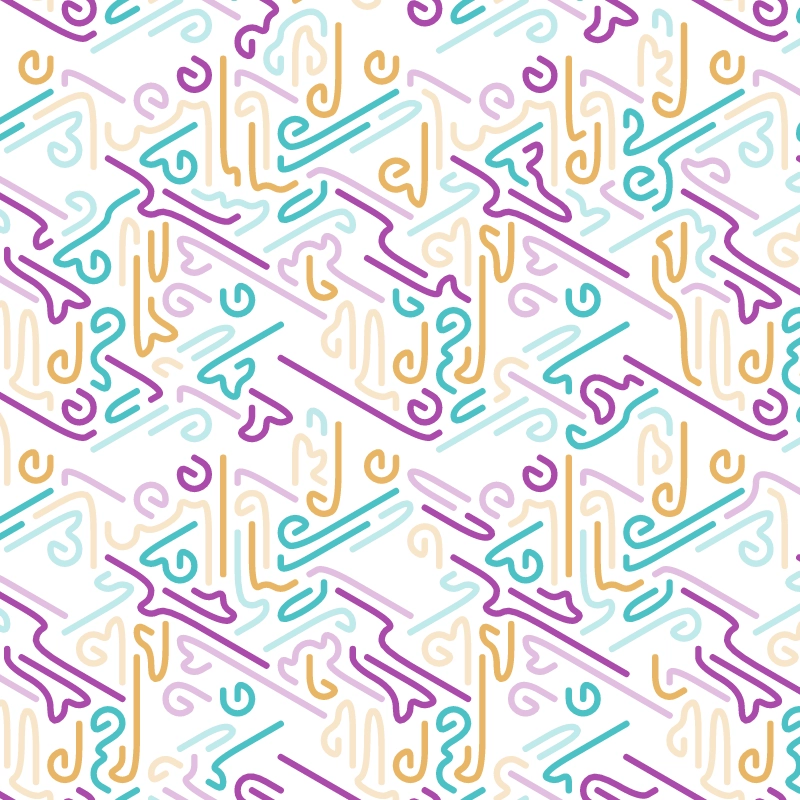
Curvesnot applied.
Breaksis a boolean controlling whether or not the pattern of the initial line placement is uniform or not. Whentrue, the pattern is modified at least once while lines are placed causing the repetition in the image to break down.Breaksapplied.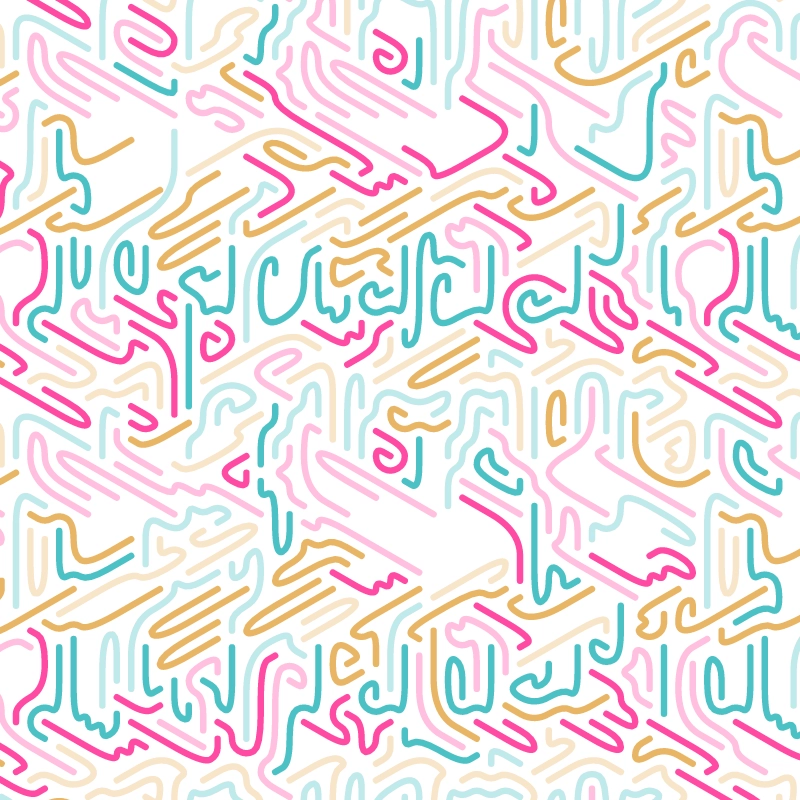
Breaksnot applied.
Logistics
For owners of “Lines Walking”.
Claiming a Plot
You can contact me via direct message on Twitter, or on the Plottables discord.
To claim a plot, you must be able to prove that you currently own the accompanying token (i.e. sign a message with the ETH wallet holding the NFT).
I recommend using https://app.mycrypto.com/sign-message or similar to sign a message stating how you’d like to receive your plot (e.g. “My shipping address is X”).
A plot can only be claimed once on or after the date it is made available according the schedule below.
Finally, you can receive the plot by picking it up in person (in Manhattan), or have it shipped. I will cover the cost of shipping to the lower 48 US states.
Plot Size & Details
Each plot is drawn on ARCHES 300g 9x12" Cold-Pressed Watercolor Paper, using Winsor & Newton Professional Watercolor paints.
The back is annotated with plot metadata using a rOtring Isograph pen and ink.
The frame I used in the topmost picture can be found here.
Schedule
A new plot is made available every 4 days, starting on 2022-04-04 (April 4th,
2022). (The plots were finished early, so I’m letting everyone claim their
plots according to their own schedule).
All plots are available to claim starting Friday, April 15th 2022. If you sell your token before claiming a plot, you’ve given up the right to claim it.